Friday ended a wild week of volatile trading and it was quite a reversal day. Stocks opened higher after a slightly better than expected PCE Prices inflation report. However, 15 minutes after the opening bell we got the Chicago PMI report and it was a disaster and stocks quickly rolled over. Perhaps the realization that the dismal economic data meant the Fed might be swaying toward lower rates more quickly, sent stocks higher into the close. Otherwise, I'm not sure what sparked the change in sentiment, especially in those final minutes. It seemed too soon for a capitulation.
 |
|
Daily TSP Funds Return

|
Us pesky TSP market timer type of investors are tossed overboard on a day like Friday - meaning, if the selling on Friday morning triggered us to do some buying or selling, by the close you may have changed your mind, but you were stuck. You might have tried to buy a dip, but that was gone a few hours later. You may have sold because the action was so weak, but that reversed before the close. With two IFT's a month, a noon ET deadline that pushes our trades out another business day, we are just sitting ducks for those Wall Street giants. I don't know if I said that well. Basically they see what we're doing hours before it gets done at the close and they can take advantage.
The early catalysts were the better than expected inflation data that pushed the S&P 500 up over 20-points in the first few minutes of trading, but then came that Chicago PMI number.

And that negative reaction lasted a few hours until just after noon ET - right after our TSP trading deadline was over. Stocks then bottomed and were off to the races, but amazingly, the S&P was still negative with about 20 minutes left in the trading day. The entire 42-point gain was made in those final 20 minutes.

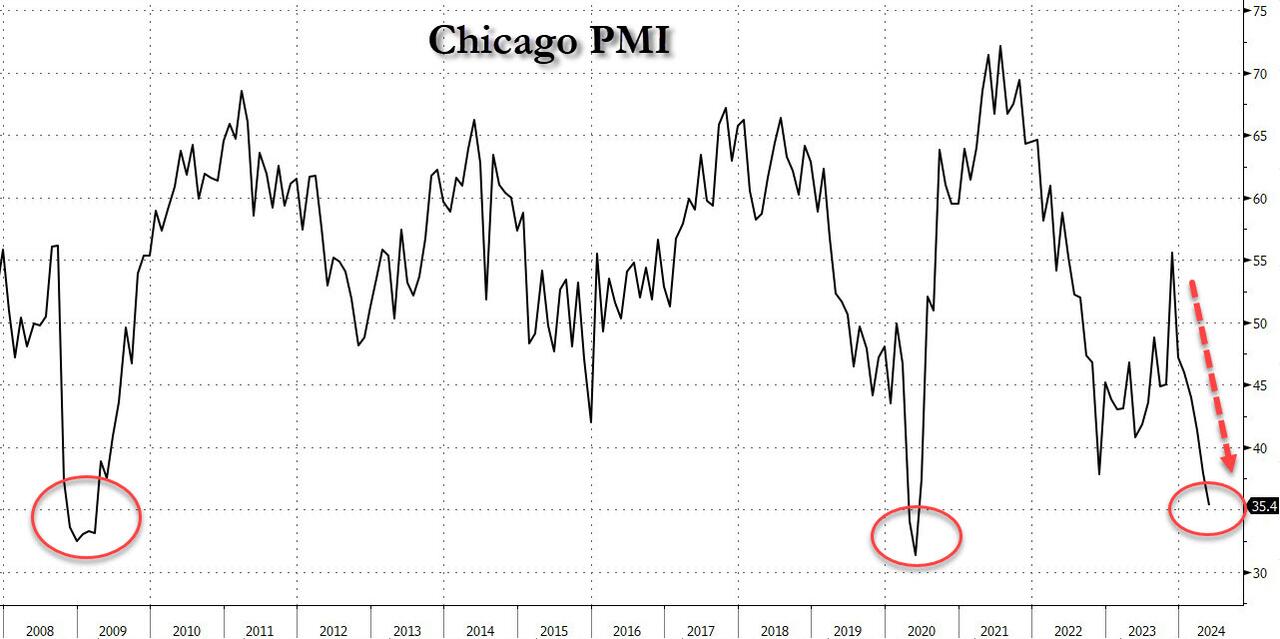
What's the big deal about the Chicago PMI? We're looking at a reading that has only been hit twice in the last two decades - once during the financial crisis, and then again during the COVID economic panic of 2020.

Source:
https://www.zerohedge.com/economics/chicago-pmi-unexpectedly-craters-depression-levels
So the day turned into a mighty reversal day, and it was a positive outside reversal day, which is as bullish as the negative outside reversal days have been bearish for stocks, but given the freakishness of the move on Friday, I am now torn because there may be one more test.
In Friday's commentary I said this about the chart development:
"Watch out for a possible fake out rally today [Friday] - and I only say that because we had a similar move after the PPI triggered rally on April 11. After the negative outside reversal day and some overhead gaps opened, the PPI report on April 11 sent stocks higher and filled an overhead gap, similar to the one that we have on the chart now. The rally on April 11 failed the next day."
This was all following that April 4th negative reversal day, and that comparison to the current action is still going on...

The above chart was before Friday's action.
And here's how it played out on Friday. Very close to that April PPI rebound. It didn't fill the stealth gap, but it tested the descending resistance line within the range of the negative outside reversal candlestick.

And the reason that's meaningful is because here's how that played out afterward in April.

The difference may be the tremendous trading volume that we had on Friday which makes it feel more legitimate. Although in the short-term these can go a few ways...

This could gap up on Monday and stocks will be off to the races. That leaves the underinvested behind and they can either be patient or do some FOMO buying, which could lead to another big day on Monday.
The other option is that we see Friday's rally get retraced and that will hurt any FOMO buyers. Based on the April chart, some backing and filling is possible, but again the tremendous volume could have made it "different this time."
The 10-year Treasury Yield was down on the better than expected inflation data and the weak Chicago PMI data, but maybe not as much as you might expect considering what the stock market did. I would have expected to see this plummet below the 50-day EMA after that combination. Maybe that is telling us something - like yields are more stubbornly strong, for whatever reason. It will be interesting to see how they trade early this week considering the late rally in stocks on Friday. Remember, the bond market closes an hour before the stock market each day, so it was already closed during that late surge higher in stocks on Friday.

The dollar was down but it too closed off the lows and it wasn't much of a move considering the reaction in the stock market. It did fall below the 20-day EMA but it climbed back above its 50-day EMA by the close.
And not to beat a dead horse, but these next two charts are showing just how important that late rally was on Friday. The top chart is the weekly S&P 500 chart showing a nice positive reversal candlestick, which makes it look like the market wants to continue higher. Maybe we retrace some of that action down to 5200, but it looks bullish. But...

... had the market closed a few hours earlier, the weekly chart would have looked completely different and much more troublesome, and I would have been looking for another test of that green 20-week average. Now, I'm not so sure, although we do still have that April comparison to worry about.
The May AutoTracker winners have been posted, and what a month it was. Here are the winners and here are the monthly and annual (non-premium members) standings through May. That reversal on Friday dramatically changed the outcome. Without that reversal my return (TSP Talk Plus System) would have been in the top 5 for the year. Instead the reversal gains in the C-fund pushed met down 60+ spots. Now I have to fight my way back. :)
I tend to have the most to say in my Monday commentaries, and Friday's action sure made that the case this week. But for some reason I consistently get the fewest reads / hits on my commentary page on Mondays. I assume it could have something to do with it being a popular AWS day, I don't know. Anyway, I sure would appreciate anyone forwarding this to someone who you think might be interested, whether sending the link or re-tweeting (once it's posted on X), or whatever the kids are doing these days. I think the buy and holders are going to have some trouble in the next couple of years, and maybe we can convert some of them. :) Thanks!
There is a lot to dissect here on the S&P 500 (C-fund) chart. The early pullback on Friday nearly tagged the 50-day EMA before reversing higher. I looked at the longer-term chart and it's actually very rare to see it come that close and not hit the average first before reversing. From November through March it never even got close to the 50-EMA, but going back a few years, I don't see any other time when it came within 10-points or so and didn't actually hit it. The PMO indicator gave its moving average a kiss but may be trying to avoid a crossover - or maybe this is the oversold rally that we tend to see when they first cross. But those rallies are usually temporary. The high volume is eye opening, and quite surprising given the lack of a catalyst for something like this to happen. There is still an open gap down by 5075. As you'll see next, the DWCPF (S-fund) chart did fill its similar May 3rd gap on Friday.

DWCPF (S-fund) filled that gap and cleared testing its 50-day EMA, so this looks a little more legit. It's still below some resistance, but that might be a big inverted head and shoulders pattern, and if it can get above about 2050 again, we could have a 2200 target on this chart - IF it recaptures 2050 first.

The EFA (I-fund) survived its test of the March highs. This looks good as long as the dollar cooperates.

BND (bonds / F-fund) had a big day and that rally on Friday, which looks a little bigger than the move in the 10-year Treasury Yield might suggest, and it has cleared two levels of resistance with that 0.67% gain on Friday. Very interesting, and this is either because of the slightly better than expected inflation report, or the devastatingly weak Chicago PMI. Bonds can rally in weak economic environments as long as the Fed is considering lowering rates.

Thanks so much for reading! We'll see you back here tomorrow.
Tom Crowley
Read more in today's TSP Talk Plus Report. We post more charts, indicators and analysis, plus discuss the allocations of the TSP and ETF Systems. For more information on how to gain access and a list of the benefits of being a subscriber, please go to: www.tsptalk.com/plus.php
For more info our other premium services, please go here... www.tsptalk.com/premiums.html
Daily Market Commentary Archives
To get weekly or daily notifications when we post new commentary, sign up HERE.
Like what you're seeing on TSP Talk? Why not Tell a Friend about us? We'd really appreciate it, and they may too.
Thanks!