Thomas Crowley (@TommyIV)
Investors are growing impatient with the spending habits of companies in the AI circle. On Wednesday after the closing bell, Meta reported its highest quarterly revenue on record, but its heavy spending to stay ahead in the AI race out led to the company falling short of net income expectations and its free cash flow went into negative territory for the first time since it became a public company. Their plan for 2027 is “to continue investing aggressively”.
With hundreds of billions of dollars already spent and hundreds of billions more locked in future spending commitments, investors are starting to question if consumer demand will reach profits proportionate to the level of risk, capital, and time committed.
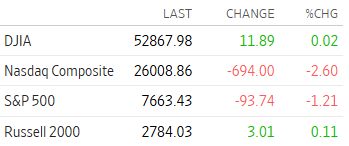
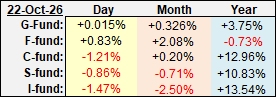
Meta’s after-hours stock price initially jumped after the earnings release. But enthusiasm for record earnings faded into discontent on spending pushing stock price lower by Thursday’s open. The inertia from the Meta decline ignited a broader sell-off across AI trade and Meta ended the day with a 7% loss. The C-fund, heavily exposed to the AI trade, fell 1.2% for the day.
 |
|
Daily TSP Funds Return
|
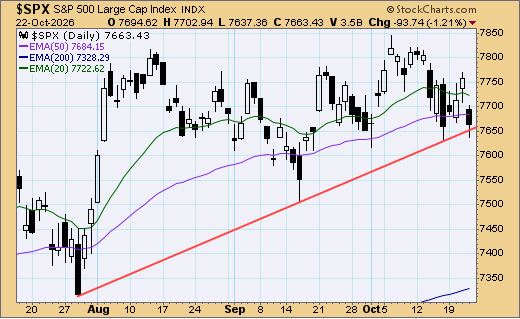
S&P 500 (C-fund) | Three-Month Chart
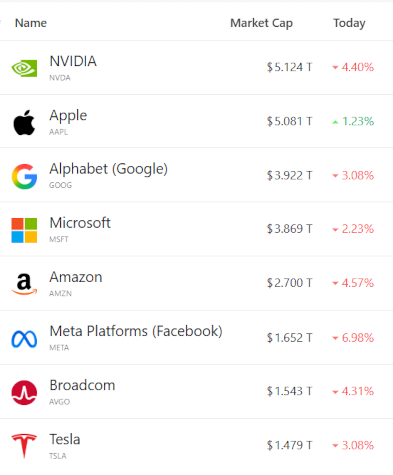
Below are the Top 8 companies of the S&P 500 by market cap and their individual returns for the day. All but Apple took on losses ranging from 2.2% to 7% on Thursday. Tesla reported earnings alongside Meta, though their price jumped back to even soon after the open but faded to its 3% loss by the close.
Next week Alphabet and Microsoft report their earnings on Wednesday followed by Amazon on Thursday.
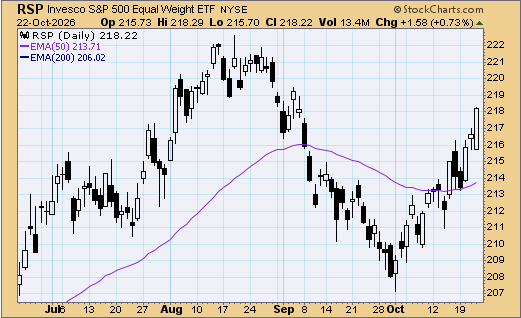
As we’ll see below, bonds were a safe haven for risk averse investors. But there was also rotation into other sectors within the S&P 500. RSP, an equal-weight ETF of the S&P 500, gained 0.7% on Thursday. This is more evidence this was an AI sell-off, not of equities all together.
S&P 500 Equal Weight ETF
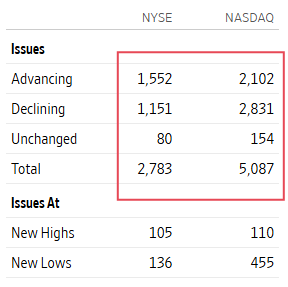
Across the market, breadth was 46% positive.
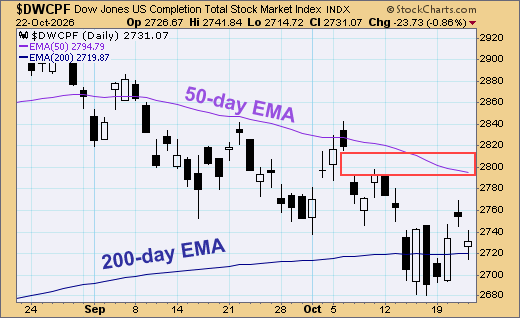
The S-fund was not spared from the selling. Twenty-two percent of DWCPF stocks are within the tech sector including some of its most heavily weighted constituents like SpaceX and Snowflake. The S-fund lost 0.8% on Thursday.
DWCPF (S-fund) | Two-Month Chart
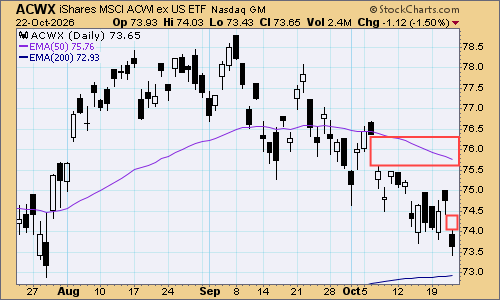
ACWX lagged the U.S. markets. The AI exit stretched across global markets particularly hitting the semiconductor market. Attacks in Saudia Arabia also have global markets nervous of re-escalation of conflict in the Iran war.
ACWX (I-fund) | Three-Month Chart
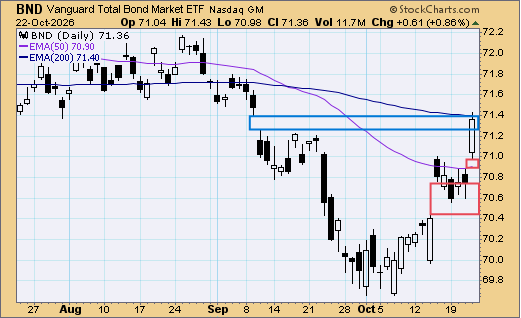
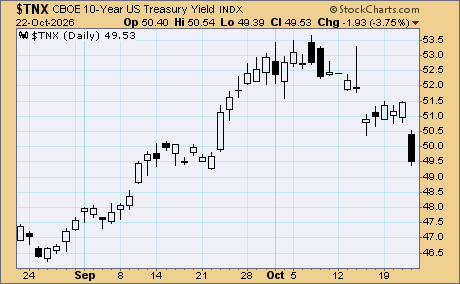
Bond prices spiked today as they were the target for many investors seeking to reduce risk in the face of a potential deeper equity sell-off. The 10-year Treasury yield felt its largest one-day drop since March 2023 pushing it back below 5%. The F-fund price was up 0.8% on Thursday.
BND (F-fund) | Three-Month Chart
10-year Treasury Yield
Thanks so much for reading! We'll see you back here on Monday.
Thomas Crowley
Read more in today's TSP Talk Plus Report. We post more charts, indicators and analysis, plus discuss the allocations of the TSP and ETF Systems. For more information on how to gain access and a list of the benefits of being a subscriber, please go to:
www.tsptalk.com/plus.php
Updated monthly:

Questions, comments, or issues with today's commentary?
We can discuss it in the Forum.
Daily Market Commentary Archives
For more info our other premium services, please go here...
www.tsptalk.com/premiums.php
To get weekly or daily notifications when we post new commentary, sign up HERE.
Like what you're seeing on TSP Talk? Why not Tell a Friend
about us? We'd really appreciate it, and they may too.
Thanks!