  |
|
| TSP Talk | Market Comments | TSP Tracker | Premiums | Site Map | TSP Funds | Message Board | Returns |


TSP | Thrift Savings Plan - Talk
| Intrepid_Timer Investment Strategies | ||||||||||||||||||||||||||||||||||||||||||||||||||||||||||||||||||||||||||||||||||||||||||||||||
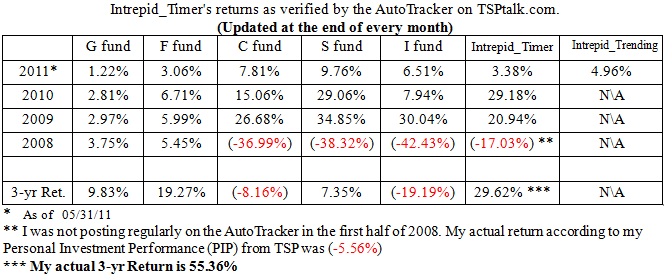
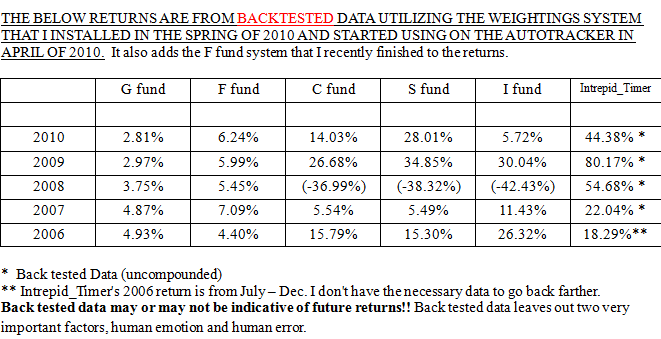
Intrepid_Timer Strategies Return:
Prior Intrepid_Timer Strategies Returns:
| ||||||||||||||||||||||||||||||||||||||||||||||||||||||||||||||||||||||||||||||||||||||||||||||||
|
Intrepid_Timer's Daily Commentary
|
||||||||||||||||||||||||||||||||||||||||||||||||||||||||||||||||||||||||||||||||||||||||||||||||
Current Signal for Intrepid_Timer: A BUY equities signal was issued on 06/06/2011. Current Signal for Intrepid_Trending: A signal to go to 100 S was given on 06/06/2011. For TSP, a “BUY equities” signal means BUY C, S, or I funds. For ETFs and mutual funds, this means SELL short positions and BUY long positions. A SELL signal for the F fund was given on 06/06/2011. Current Allocation For Intrepid_Timer: 100% S fund. (1 IFT left for June) Current Allocation For Intrepid_Trending: 100% S fund. (1 IFT left for June) Current Allocation For ETFs and Mutual Funds: 100% long positions. There should be no signal changes on 06/13/2011. (Posted at 8:25pm ET on 06/12/2011) I would like to extend a warm welcome to everyone taking advantage of today's free trial, which allows you an opportunity to check out my past commentaries. In my commentaries, I provide not only the current signals for my Timer and Trending systems, but I also provide information on current economic reports, analysis of historical data, discussion of various chart patterns (hopefully before they come to fruition), investment strategies and resources outside of TSP and anything else that may provide information to help us improve our investment returns. In addition to my commentaries and trading system signals, once you sign-up, you are allowed access to my premium services talk thread on the TSP Talk Message Board. This is where subscribers hold discussions with one another as well as myself, ask questions about my strategies and other investment options, provide suggestions to better improve my service and perhaps even vent a little bit when we have a bad day in the markets. This area will not be available for viewing today as each person has to be granted access individually. For more information about getting into the premium talk threads after you sign-up, you can go to this link, or http://www.tsptalk.com/mb/showthread.php?5010-How-to-Get-Started-in-This-Forum I also have a thread in the same premium services area where I post my signals daily as we well as a newly implemented strength of signal indicator. I recently made some adjustments to my Timing system so you may want to read my “Special Report” that I published on May 14th to give you some insight into why and what I did. Commentary for 06/13/2011 Well it was not a good day for us in the S fund Friday as we were down 1.58%. Since the previous day had brought us back to right about our purchase on June 6th, I am considering Friday to be just one down day in our current trade instead of one day up, one down, one up and one down. You will also notice that the strength indicator for my Timer system turned negative on Friday, which is indicative of a declining market, but we remained on a buy signal for equities. This is because even though the majority of the eight indicators I follow for my Timer system had turned negative, my proprietary timing strategy did not allow a sell signal to occur on this day. This is one of the main problems with many swing trading platforms. The person who developed the system may follow the right indicators, but they don't necessarily use these indicators in the correct manner as it relates to swing trading and timing the markets. This is why I have stated that a good market timing system not only starts out as (A + B + C = X), but it takes it a step farther and becomes (A + B + C = X, if Y = Z). This coming Friday happens to be Quadruple Witching. Quadruple Witching is a day that market index futures, market index options, stock options and stock futures all expire. This occurs the third Friday of every March, June, September and December. Because of this, I went looking back through five years of data to see if I could find any historical patterns to give us some sort of trading advantage. Although the major part of my Timing system is based on up to the minute data, the proprietary timing part is based on historical data and patterns. I didn't really find anything usable as far as this particular day is concerned, as past Quadruple Witching days have been up and down, but mostly flat (This is based on closing prices and not intraday activity). However, I did find that this week happens to end higher than the previous week a large part of the time. Going back to 2006, every year except 2008 has produced three Quadruple Witching weeks that ended higher than the previous week and one that ended lower. In 2008 there were two that ended higher and two that ended lower. This would lead us to believe that this week has a greater chance to end higher rather than lower, especially with the Quadruple Witching week this past March already ending lower. This would seem to give us an advantage to base our trades on this week. However, when I started looking closer at past June's in particular, I discovered another pattern that may even give us a bigger trading advantage. Over the past 5 years, June has ended lower 3 times and ended pretty much flat twice. Also, every June except one has seen it start off lower, bounce heading up to Quadruple Witching and then falling immediately afterward, at least short term. This fall didn't always start on Quadruple Witching day, but it was within a couple days of it. Below are my findings: June 2006 (Quadruple Witching Week 12-16) June 2007 (Quadruple Witching Week 11-15) June 2008 (Quadruple Witching Week 16-20) June 2009 (Quadruple Witching Week 15-19) June 2010 (Quadruple Witching Week 14-18) June 2011 (Quadruple Witching Week 13-17) Do you notice the pattern? Every year except one since 2006 has seen June start off the month with a pullback and then seen a quick bounce before ultimately pulling back once again. That bounce typically happens in the days leading up to Quadruple Witching before the pullback continues. 2009 saw the complete opposite, but we already know how this month has started. By looking at this historical data, we can see a high probability of at least a two to three day bounce here before the pullback continues. We'll be discussing what July may bring in my premium talk thread on TSP Talk and in my future commentaries. Like I've stated before, each buy and sell signal that I get is connected to the previous signal. Although it appears that my buy signal on the 6th was a few days premature, up until the 9th it was pretty much a push. If the buy signal hadn't happened until the 10th, I might not get a sell signal until after this possible bounce plays out and we move back down lower. As it is now, my Timer system could give a sell signal pretty much any day this week. Currently we are down about 1.73% in this trade, but were able to buy the S fund 4.34% cheaper than where we last sold it. On the economic front, as I stated in my commentary on Friday, import and export prices came in lower than last month on Friday morning. This will help ease inflation concerns and should help to improve the Producer Price Index (PPI) and the Consumer Price Index (CPI) reports on Tuesday and Wednesday. Thoughts and prayers go out to my friends and fellow compatriots in Arizona who are dealing with massive wildfires at this time... Quote of the Day: Live, laugh and love!!!!!!!
|
||||||||||||||||||||||||||||||||||||||||||||||||||||||||||||||||||||||||||||||||||||||||||||||||

| ||||||||||||||||||||||||||||||||||||||||||||||||||||||||||||||||||||||||||||||||||||||||||||||||
 | ||||||||||||||||||||||||||||||||||||||||||||||||||||||||||||||||||||||||||||||||||||||||||||||||
|
| ||||||||||||||||||||||||||||||||||||||||||||||||||||||||||||||||||||||||||||||||||||||||||||||||
|
Overview Of Intrepid_Timer's Trading Strategies | ||||||||||||||||||||||||||||||||||||||||||||||||||||||||||||||||||||||||||||||||||||||||||||||||
|
Premium Services Rules for message board members: Once you sign up for the Premium Service, registered message board members can simply send Tom a PM and he'll grant you access to the premium services message board. See this post for how to get started. I'll still be talking about the market in general in my regular account talk thread, but giving out Premium Service Information in the public forum is not acceptable and may get you banned from the message board. If you are trying to get permissions to be added* to my Premium Service area of the message board, please send the following information to Tom (tsptalk) through a private message: 1 - your premium service login name (email address*), 2 - your payment method (PayPal or credit card), 3 - duration of subscription (1, 6, 12 month, etc) and 4 - which of the services you have a current subscription to. *You need to be a registered member of the message board (www.tsptalk.com/mb/register.php) Please check out the following two links for more information on the premium services: http://www.tsptalk.com/faq2.html (Frequently Asked Questions)
If you have any other questions, please let Tom know. Thanks. |

DISCLAIMER: I am not a registered investment adviser and am not providing investment advice or recommendations to anyone. The information contained here is for educational purposes only. This information is being made available to show what is possible and what is not possible with the current TSP trading limits and with other investment resources outside of TSP. These TSP allocations and ETF/mutual fund buy and sell signals are purely hypothetical and past performance is not indicative of future results. I may or may not be using these securities at any given time for my own personal investments. Your investment losses and gains are your own responsibility. Please consult an investment professional before buying any investment security.
TERMS AND
CONDITIONS
Upon subscribing, you agree to the following:
| - Intrepid_Timer is not a Financial Analyst, Investment Broker or Financial Advisor. A knowledge of your own investment goals and a possession of fundamental trading abilities, or a desire to procure those abilities, should prerequisite your signing up. | ||
| - Intrepid_Timer nor TSPtalk.com shall under no circumstances be liable to any visitor, user, and/or any third party for any lost profits, lost opportunities, indirect, special, incidental, consequential, punitive, or any other damages whatsoever. | ||
| - Intrepid_Timer nor TSPtalk.com assumes no responsibility or liability for any inaccuracies, misstatements, errors or fabrications contained within documents, data, materials or web site pages contained herewith and associated pages, either through error or negligence. | ||
| - You agree to hold Intrepid_Timer and TSPtalk.com harmless for any act resulting directly or indirectly from this site, it's data, content, materials, associated pages and documents. | ||
| - The information contained here may not be published, broadcast, rewritten or otherwise distributed without prior consent from Intrepid_Timer. |
|
S&P 500 (C fund) 1d 5d 3m 6m 1y 2y |
Dow Completion (S fund)
|
EFA (I fund) 1d 5d 3m 6m 1y 2y |
Bonds (F fund)
|
|
TSP Talk does not guarantee the accuracy or completeness of this report, nor does
TSPtalk.com assume any liability for any loss that may result from reliance
by any person upon any such information or opinions. Such information and
opinions are subject to change without notice and are for general information
only.
|
|

| TSP Talk | Market Comments | About TSP Talk | Premiums | Site Map | TSP Funds | Message Board | Returns |