Another late sell-off
The market staged another late sell-off on Wednesday after being in
a trading range most of the day. The bulls gave up after
several attempts to break through the upside resistance.
This has become quite common over the last few weeks where either
sellers are stepping up, or buyers are running out of steam very
late in the day. This is an options expiration week so
volatility is expected. Add the options expiration volatility
to an already volatile market and I guess we shouldn't be surprised
to see this type of action.

Yesterday's PPI report came in lower than expected giving the bulls something to
cheer about out of the gate, but they couldn't keep the pressure on. Once
the S&P 500 moved to the 1490 area, the area we expected to see some resistance,
the market seemed to run out of steam.

Chart provided courtesy of
www.decisionpoint.com
Drawing a parallel
trading channel along the new down trend and we have the makings of a possible
trading range with a negative bias. The upside is the 1490 area and the
low end is dropping about 4 or 5 points a day.
Today's CPI report, which is another indicator of the inflation situation, could
be the catalyst for a test of the upper and / or lower ends of this trading
range.
Two other market negatives are the 20-day moving average moving below the 50-day
moving average, and the S&P 500 closed below the 200-day moving average.
All of these averages will pose as possible support or resistance as the S&P
approaches them.
We have the weekly sentiment survey going
on today. Are you bullish or bearish for next week?
I don't want to influence your vote too much, but here is the Thanksgiving
seasonality chart. The day before and after the holiday are quite strong
historically, but afterward, it gets very red.
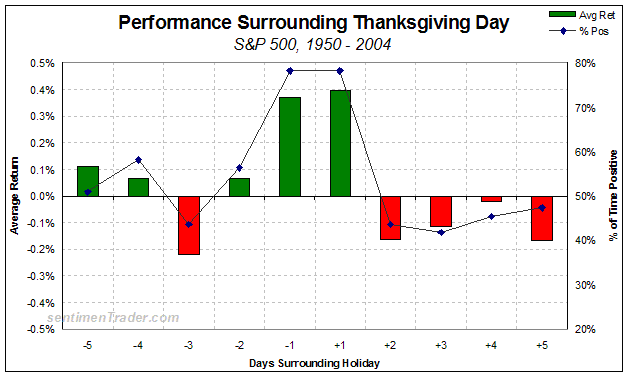
Chart provided courtesy of
www.sentimentrader.com
Attention EbbChart System subscribers: If you didn't see it
already, there was a change made last night to the system's allocation for
Friday. So the fund posted yesterday is not where the system will be.
Please check the members' area for
the updated signal.
That's all for today. See you tomorrow.
Have questions? Visit our
message board
for answers.
Would you like to be on our
email alert list?
We will send you an email when there is a change to our asset allocation
or market outlook. Your email address will never be given out.
Read our
privacy policy.
By signing up you agree to the TSP Talk
Terms of
Service. More details below **.
Are you bullish or bearish?
Join the Weekly
Sentiment Survey.
Like what you're reading?
Tell a Friend
about us.
|

 Printer friendly