
Originally Posted by
JTH

Hi Tom
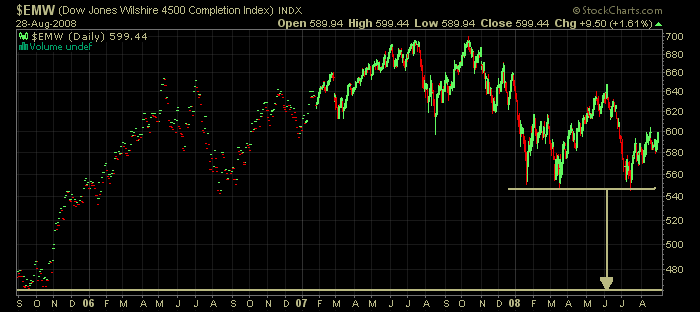
I've been watching what appears to be the Year To Date Head and shoulders forming on $EMW.
It looks to me like we are nearing the completeion of the top section of the right shoulder. The neckline appears to be at 550 and the peak of the head is at 650. If I'm correct would this make the price target at 450? There seems to be some major support levels going back to October 2006 to support this.
To me that would seem like a drastic downturn, so I was wondring what your take on it is?
Thanks... JTH


 Likes:


 Reply With Quote


Bookmarks