
 Likes:


 Reply With Quote
Why not just pop over the 200 EMA.Will the VIX confirm this and do the same:


Label my moving averages to EMA's.
Don't bias your charts.Show support and resistance. My comments and charts are not trading recommendations.
Why not just pop over the 200 EMA.
Don't bias your charts.
200 EMA tested from above:
Don't bias your charts.
VIX doesn't want to give up the 200 EMA. It might be setting another high confirming my orange channel:
Don't bias your charts.
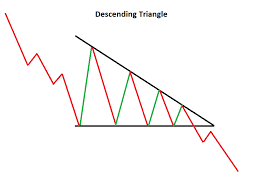
Can you see the Descending Triangle continuation in the VIX:
Don't bias your charts.
I was thinking of locking in my 7% gain today but staying 100 S Fund because the 200 day holding gives me the feeling that it's 60/40 we won't fill the recent gap in the short term:
Don't bias your charts.

Same. I was thinking about locking in my 4.25% gain. Of course, that would have been a +/- depending upon how it does today. It would seem that the trend is our friend. But, we should expect taking some hits while we are in. As long as the positives outweigh the negatives, we'll keep our heads above water.Originally Posted by Bquat

"Treat your wife with honor, respect, and understanding as you live together so that you can pray effectively as husband and wife." 1 Peter 3:7
Today's action has us a little ahead of schedule for my P 1:
Don't bias your charts.
Preliminary calculation is that I'm in the green for the year.
Don't bias your charts.
159 on the Autotracker. Annual gain at 0.72 and almost 10 percent gain for the month. I think this may be my best month ever.
Don't bias your charts.
Getting little bottom tails in S Fund. 100 EMA rising slightly.Seeing more strenth than I was thinking, Volatility is out in the VIX:
Don't bias your charts.
Positive thoughts:
Unemployment claims are declining in weekly amount of increase.
Economy is slowly opening up.
I think overall unemployment may start dropping.
Locally:
Gas prices up.
Some of the Dr. Offices I go by have a lot more cars in parking lot.
Local traffic is picking up.
Don't bias your charts.
 Posting Permissions
|
S&P500 (C Fund) (delayed) (Stockcharts.com Real-time) |
DWCPF (S Fund) (delayed) (Stockcharts.com Real-time) |
EFA (I Fund) (delayed) (Stockcharts.com Real-time) |
BND (F Fund) (delayed) (Stockcharts.com Real-time) |
||
|
Yahoo Finance Realtime TSP Fund Tracking Index Quotes |
|||||


Bookmarks