
 Likes:


 Reply With Quote
Just to be clear...I wasn't being sarcastic.Originally Posted by RealMoneyIssues

I just thought it looked prettier.


Niiiice... been a long time since I have seen the sarcastic font on this board
Rules:
- Trade what you see, not what you believe
- Don't put stuff in your signature that a Mod doesn't like
"Government exists to protect all peoples rights, not some peoples feelings." - A. Barton Hinkle
Great Tools:
http://www.CreditKarma.com
http://www.Mint.com
http://www.SaveUp.com/r/nmJ

Just to be clear...I wasn't being sarcastic.
Almanac Trader
"On a closing basis, the S&P 500 has corrected 12.4% from its high on May 21 to its low on August 25. After four years absent a pullback of this magnitude it is no wonder many are concerned the market is signaling something far worse could be about to materialize. But, just how good of an indicator is the S&P 500? Is it really forecasting a U.S. or global recession in the near future? A look back at S&P 500 past track suggests about a 1 in 3 chance of recession at this point.
First a quick review of definitions. A bear market is defined as a 20% or greater decline in the S&P 500. A correction would be a decline greater than 10% and less than 20%. Based upon these definitions every bear market begins as a correction, but not every correction becomes a bear market. As of today, the S&P 500 is in a correction only.
Since June 15, 1948 there have been 11 S&P 500 bear markets and 23 corrections including the current one. Since the future is unknown, we will exclude the current correction from the tally meaning there have been 33 declines in excess of 10%. However, the National Bureau of Economic Research has only identified 11 recessions over the same time period. This works out to 1 recession out of 3 S&P 500 declines in excess of 10%. One out of three might be great in baseball, but it is not so good elsewhere. Relying solely on the S&P 500 to forecast the next recession is not the best idea as it has been wrong 2 out of 3 times."
Almanac Trader
"Patience is still in order. We are getting ready for our perennial Best Six Months Seasonal MACD Buy Signal, but there is no rush. The market is still reeling from the recent selloff and the technical and fundamental picture is not yet so favorable. Fundamentals may not improve so much over the next six months, but technical market indicators likely will – at least over the short and intermediate term.
While we anticipate a fourth quarter rally, new highs will be hard to come by. Seasonality has been rather helpful this year. We have been cautious since the spring and on the sidelines for the most part since our June 4 NASDAQ Best Eight Months MACD Sell Signal. The carnage that occurred in the worst two months (August and September) is nearing the end, though it does not appear to be over just yet.
In the meantime the Three Peaks and a Dome House Top Pattern (3PDH) we have been tracking since last October, has run its course. This is not to say that the market will not go any lower, but by definition it has reached its minimum low which corresponds to the separating decline low of last October at points 10/14. In the chart below of the 3PDH we have also drawn the pending set up of a “W” bottom pattern or a 1-2-3 swing bottom formation (Our good friend John Person schooled us on this pattern several years ago.) A break above the mid-September high around DJIA 16750 would be bullish."
Martin Pistorius: How my mind came back to life
Imagine being unable to say, "I am hungry," "I am in pain," "thank you," or "I love you, losing your ability to communicate, being trapped inside your body, surrounded by people yet utterly alone. For 13 long years, that was Martin Pistoriuss reality. After contracting a brain infection at the age of twelve, Pistorius lost his ability to control his movements and to speak, and eventually he failed every test for mental awareness. He had become a ghost.
Amazing story. Watch the video when you all have time.
Almanac Trader
Unlike last years late Q3/early Q4 market swoon, there was no sharp V-bottom this time. Instead the market appears to be forming a 1-2-3 or W bottom. Thus far, the retest of the Augusts low has been a success. Now the market will need to climb above its mid-September highs.
Almanac Trader
"Although the market did take a breather today, (6-Oct) it is still on course to trace out and likely complete a “1-2-3” or “W” bottom formation pattern. The market also afforded us an opportunity to close out defensive positions in the Almanac Investor Stock and ETF portfolios and add new long exposure at better prices than available yesterday when we issued our Seasonal MACD Buy Signal.
As has been the case more often than not over the past 65 years, the market did stumble during this year’s “Worst Four/Six Months.” From our April 30 Seasonal MACD Sell Signal for DJIA and S&P 500 through yesterday’s(5-Oct) Seasonal MACD Buy Signal, DJIA was down 6.0% and S&P 500 was off 4.7%. NASDAQ’s Seasonal MACD Sell Signal was on June 4 and it was off 5.5%. The naysayers will still call this year a fluke, but DJIA’s and S&P 500’s high year-to-date was in May while NASDAQ managed to eke out a slightly higher high in July. We call this year a resounding success for “Sell in May” and our Seasonal Switching Strategy.
Looking ahead to the rest of the year, seasonal patterns are aligning for a potentially robust yearend rally. There has not been a down DJIA pre-election year since 1939. Historically, a down August followed by a down September has preceded sizable Q4 gains. The fourth quarter is also the most bullish quarter of the year (page 102 of 2015 STA). Market sentiment is no longer excessively bullish while fundamentals are mixed just enough to support a Q4 rally as expectations for an improving economy in 2016 likely begin to gain traction.
Market volatility, measured by CBOE VIX is still somewhat elevated suggesting a few more wild daily swings are more than just likely. Buy limits and stop losses in the Almanac Investor Stock and ETF Portfolios have been selected with the goal of using any volatility to our advantage while establishing new long positions on dips and avoiding the dreaded whip saw stop loss once purchased."
Almanac Trader
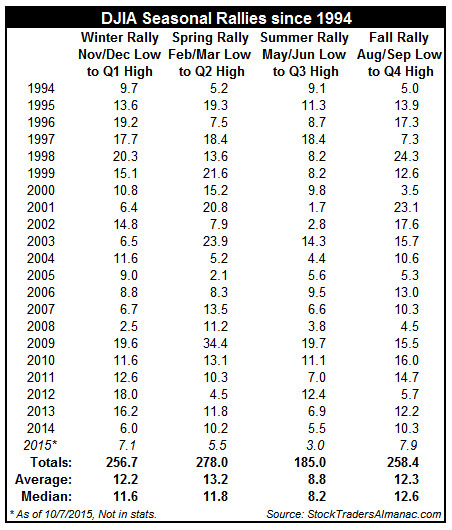
Springs Rally in the last 21 years has averaged a 13.2% gain as measured from the low in February or March to the second quarter closing high. Fall, measured from the low close in August or September to the high in the fourth quarter saw DJIA climb an average 12.3% followed by winter with 12.2%. Last and least was the average 8.8% summer rally. Based upon the average Fall Rally, DJIA could be closing in on 18,000 sometime later this fourth quarter.
Impressive S&P 500 gains from Halloween to Christmas
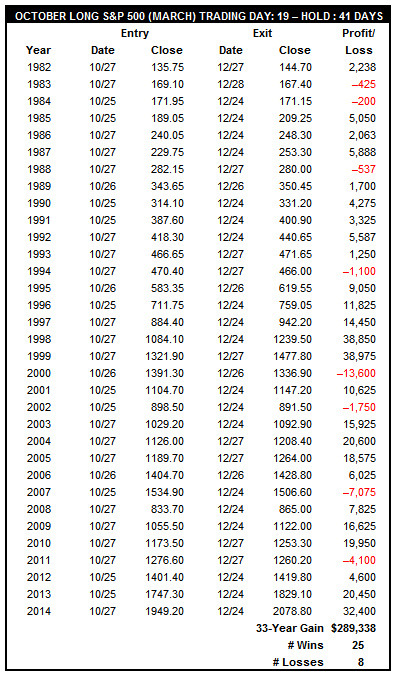
“Massive S&P 500 Gains Halloween to Christmas” is the largest dollar amount winning trade last featured in the Commodity Trader’s Almanac 2013. It now has a cumulative profit of $289,338 per single futures contact over the last 33 years including most recent data. This trade is obviously linked to the beginning of the “Best Six Months” of the year as detailed in the Stock Trader’s Almanac 2015. Going long the S&P 500 near the end of October and holding until just before Christmas has been successful 25 of the last 33 years, or 75.8% of the time. The average move during this trade’s timeframe has been 4.2% since 1982. Seasonal strength is shaded in yellow in the second chart below.
Choices to execute this trade are numerous: full futures contracts, the e-mini electronic futures or a handful of ETFs such as SPDR S&P 500 (SPY) or Vanguard S&P 500 (VOO). SPY has the longest track record, the most assets and is the most heavily traded ETF making it a top choice. VOO’s main attraction is a net expense ratio of just 0.05%. Having issued our Seasonal MACD Buy Signal on October 5, exposure to this trade already exists in the ETF Portfolio, however this shorter-term stands to reinforces the importance of using any October weakness to enter new long positions. There have been just two losses in the past twelve years. Not a perfect track record, but certainly a high probability trade setup worthy of consideration.
Almanac Trader
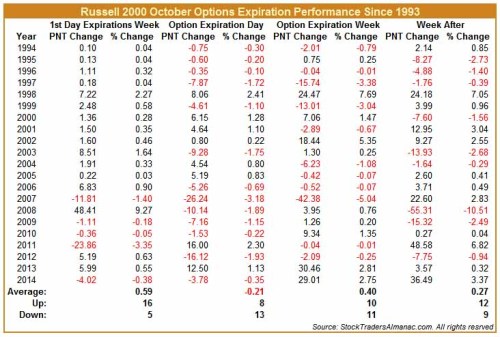
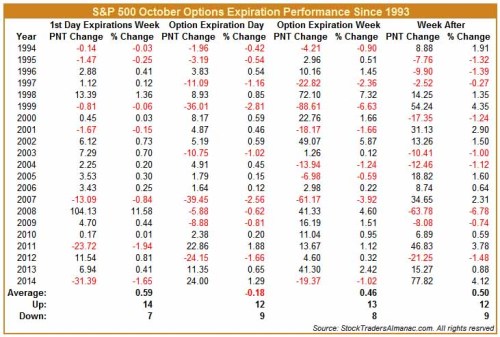
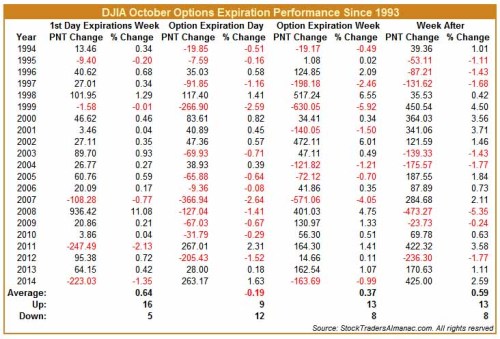
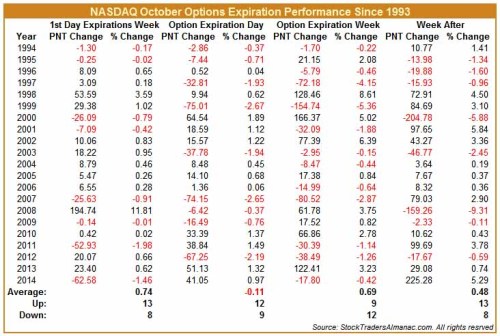
October options expiration generally bullish, but no stranger to volatilitySince 1994, the Monday of options expiration week has a bullish bias for DJIA, S&P 500, NASDAQ and Russell 2000. Expiration day however, tends to be mixed with average losses across the board even though S&P 500 and NASDAQ have advanced more often than not. Entire expiration week and the week after also lean bullish. Of note is the small-cap index streak of 13 straight advances from 1994 through 2006 (not shown, the streak is actually 17 years starting in 1990) and it has been down in five of the last eight years. Octobers reputation for volatility can be seen with wild daily and weekly swings in the tables below. Weekly moves in excess of 5% occurred in 1998, 2002, 2008 and 2011.
Almanac Trader
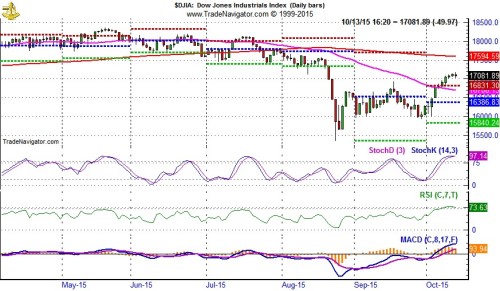
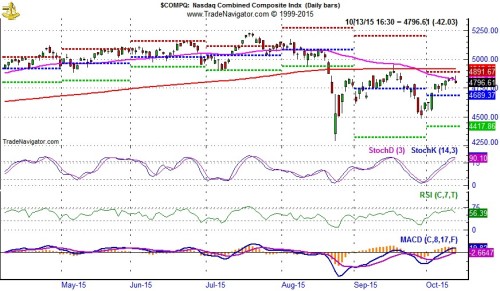
NASDAQ needs to catch up for rally to have legs
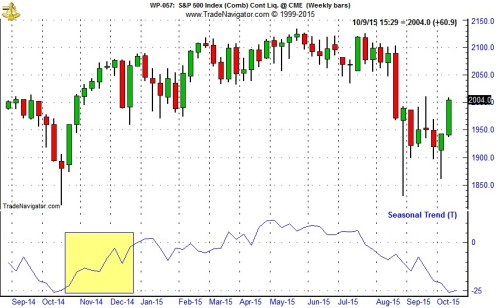
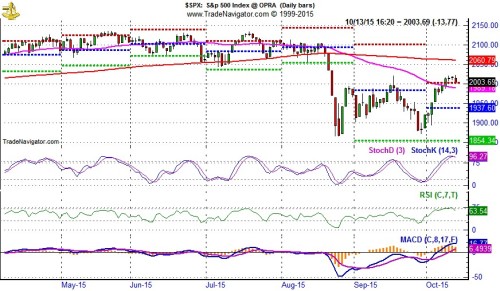
After putting up its best week of the year, the market is taking a pause to consolidate recent gains and evaluate earnings reports. For the week ending October 9, S&P 500 was up 3.3%, Russell 2000 gained 4.6% and DJIA was up 3.7% (second best of 2015). Technology was the laggard last week with NASDAQ advancing just 2.6% (seventh best week of 2015). Thus far, our Seasonal MACD Buy Signal issued after the close on October 5 has proved timely. We entered new long positions associated with our Best Six Months Switching Strategy during weakness last Tuesday and were rewarded with a fair portion of last week’s advance.
DJIA and S&P 500 have broken through resistance at their rapidly descending 50-day moving averages (solid magenta line), but NASDAQ came up short during the recent rally. For this rally to resume we are looking for DJIA and S&P 500 to hold above their respective 50-day moving averages or at worst dip and/or close just slightly below and for NASDAQ to “catch up”. Without NASDAQ leading the rally, a robust fourth quarter performance will become even more challenging for the market
Last edited by jpcavin; 10-14-2015 at 12:32 PM.
 Posting Permissions
|
S&P500 (C Fund) (delayed) (Stockcharts.com Real-time) |
DWCPF (S Fund) (delayed) (Stockcharts.com Real-time) |
EFA (I Fund) (delayed) (Stockcharts.com Real-time) |
BND (F Fund) (delayed) (Stockcharts.com Real-time) |
||
|
Yahoo Finance Realtime TSP Fund Tracking Index Quotes |
|||||

Bookmarks