Coolhand's Market Analysis
Now What?
by , 11-18-2012 at 12:22 PM (1662 Views)
Last week, the Top 50 had increased their stock allocations by 11.46% to a somewhat healthy 68.5% total stock exposure. In fact, they had increased their stock exposure every week for the previous 4 weeks. And the market ended up down 3 out of 4 of those weeks with the C fund shedding 4.98% during that time, and the S fund falling 4.41%.
The Total Tracker didn't reveal as much stock exposure last week as the Top 50 (59.04% vs 68.5%), but they didn't drop their allocations as much as the Top 50 did. For the new week, the Top 50 trimmed total stock allocations by 12% (to 56.5%), while the Total Tracker only pulled back 1.43% (to 57.6%).
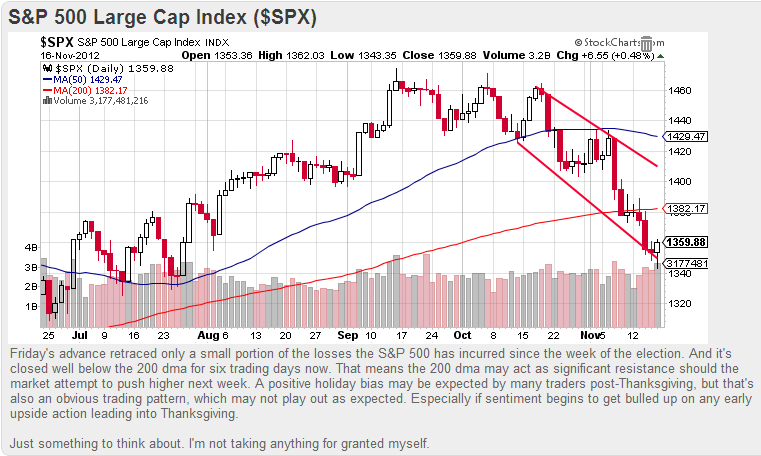
Here's this week's charts:
Our sentiment survey gave another buy signal for the coming week, but it was also on a buy last week, and that didn't turn out so great. Still, Friday's action was up so I'd not be surprised with some follow through upside action to begin the new week. But the market is in a precarious situation, so even a continuation of Friday's rally may be short lived.